Data Visualization, the graphical representation of information, stands at the confluence of art and science, making it not just a tool for analysis but a medium of storytelling. This edition of our newsletter dives into the foundational elements of Data Visualization, outlining how to choose the right charts and graphs that breathe life into numbers.
The Essence of Data Visualization
When Simplicity Speaks Volumes: The Bar Chart
Utility: Comparing quantities across categories.
Example: A bar chart illustrating music sold between 1973–2018 by format sold across different genres.
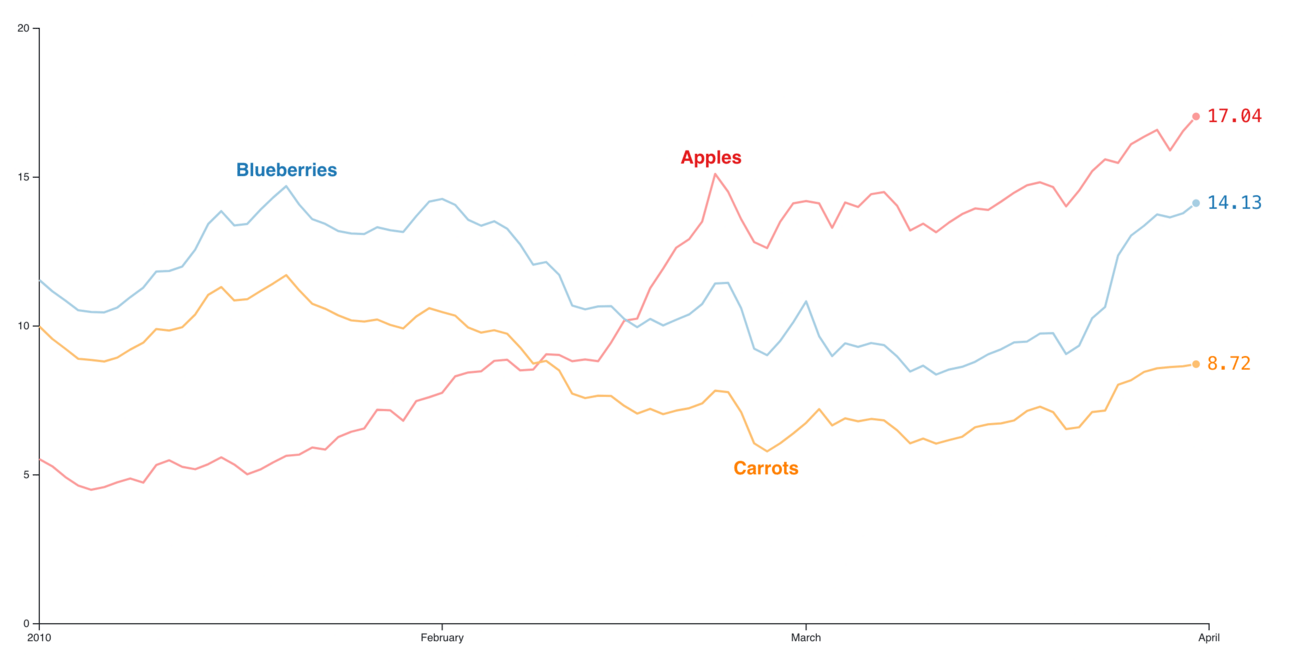
The Clarity of Trends: The Line Graph
Utility: Displaying data points over a continuous interval or time span.
Example: A line graph showing the fluctiations in cost for fruits over the a 4 month period in the past year.
A Pie(ful) of Proportions: The Pie Chart
Utility: Representing parts of a whole.
Example: A pie chart breaking down 2023 mid-year predictions for Population by Country.
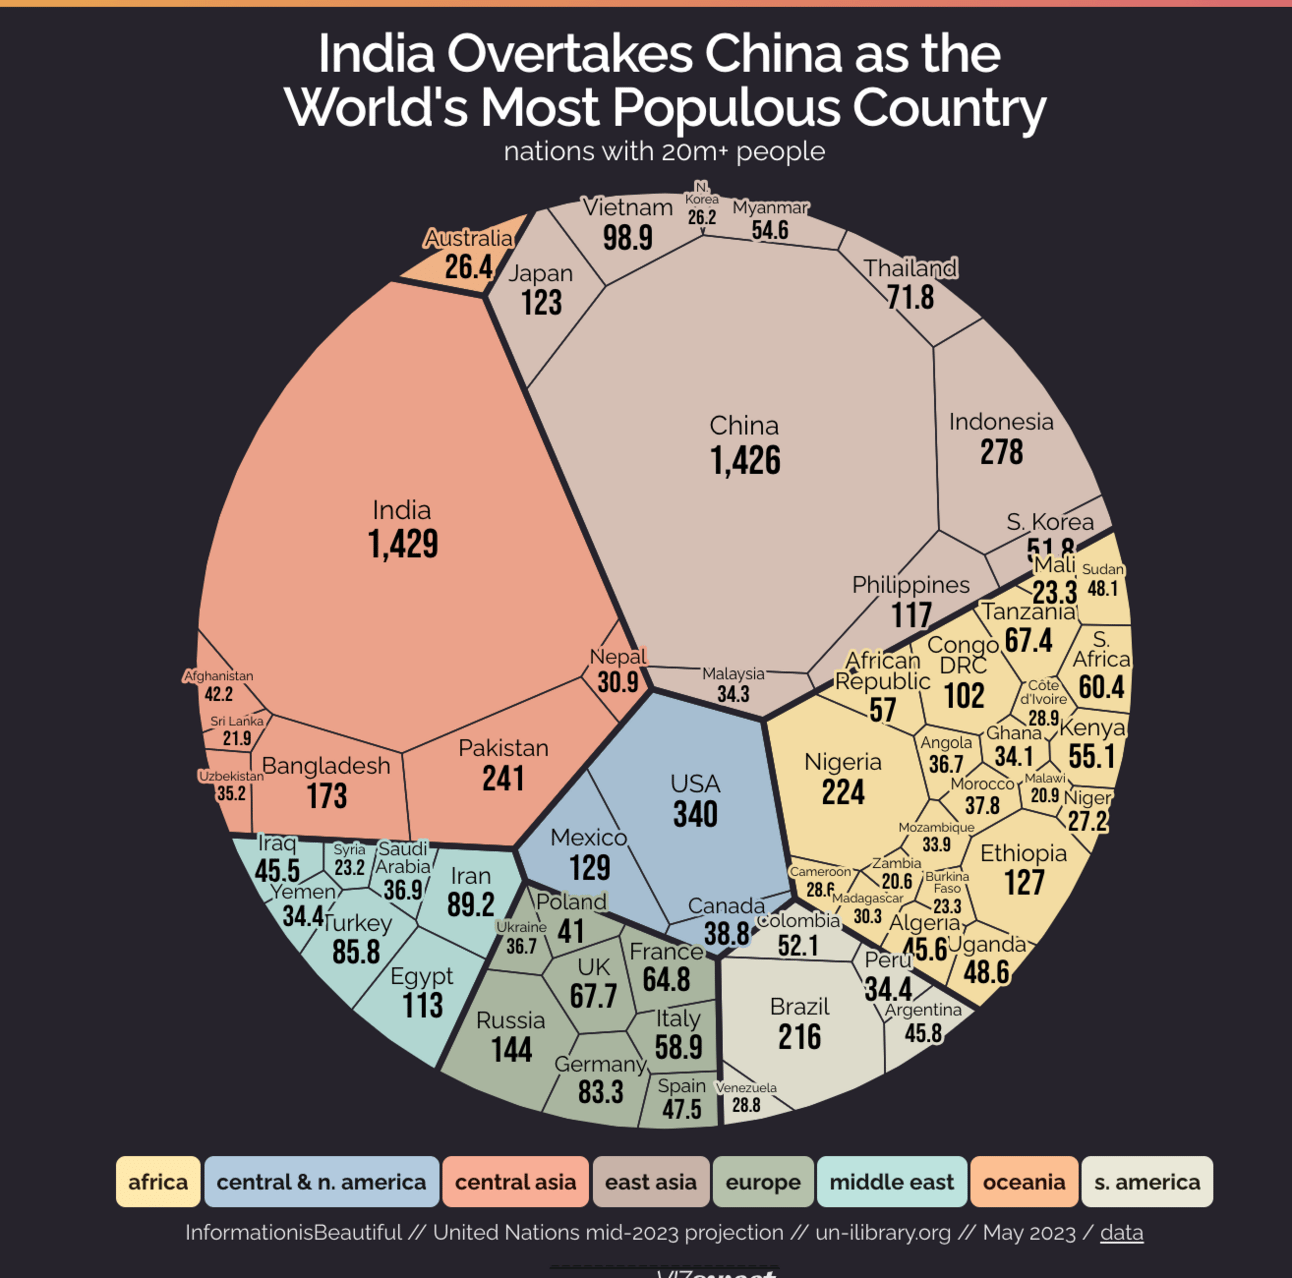
InformationisBeautiful // United Nations mid-2023 projection // un-ilibrary.org // May 2023 / data
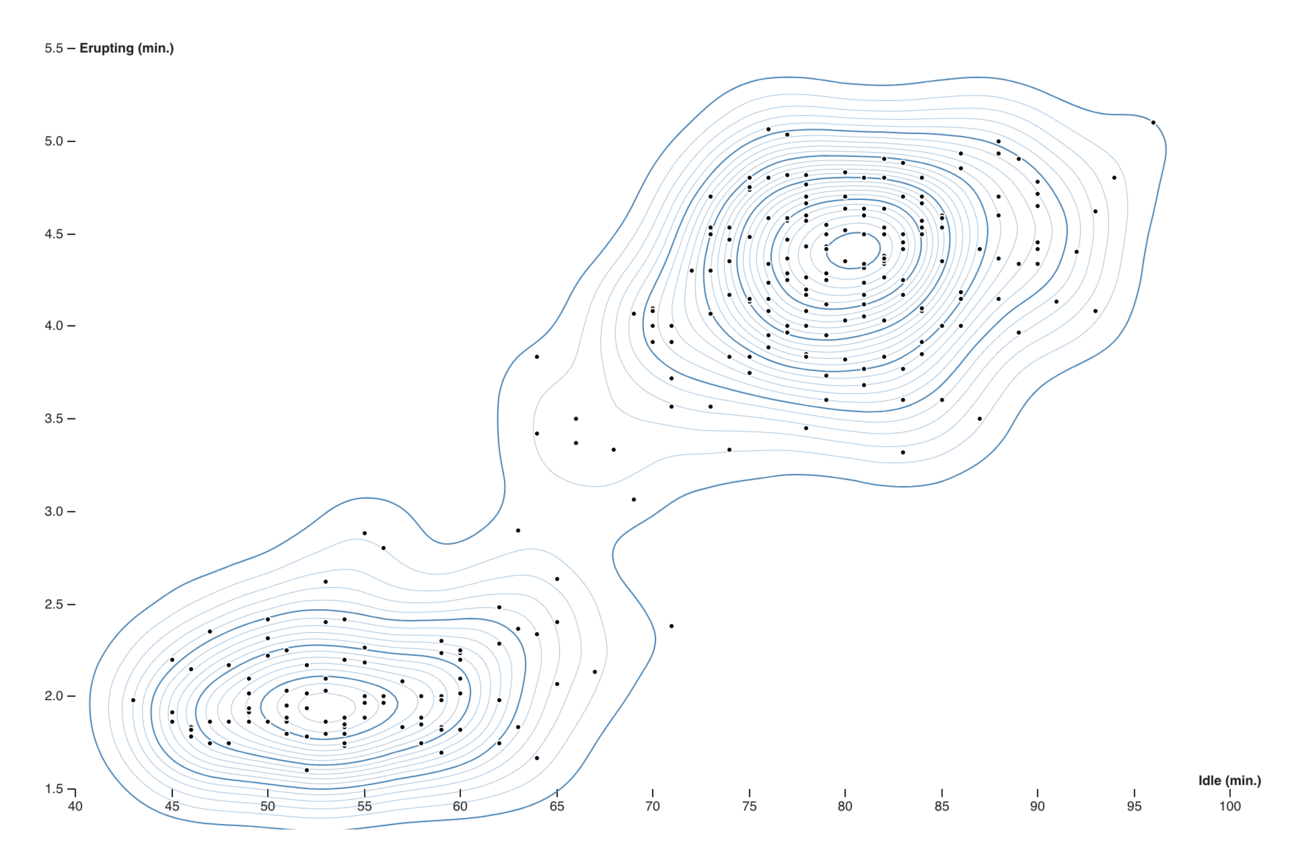
Depth and Complexity: The Scatter Plot
Utility: Observing relationships between variables.
Example: A scatter showing the relationship between idle and eruption times for Old Faithful.
Best Practices for Impactful Visual Representation:
Know Your Audience:
The first rule of effective communication is to know who you're talking to. Tailor your visualizations to their understanding and needs.
Less is More:
Clutter dilutes the message. Use colors, fonts, and annotations sparingly to maintain focus and clarity.
Accuracy is Key:
Ensure your visual elements accurately represent the data. Misleading scales or proportions can distort the message.
Tell a Story:
Don't just present data; weave it into a narrative. Use visualizations to guide your audience through a logical flow, leading them to insights.
It’s essential to dive into these stories, understanding not just the 'what' but the 'why' behind the data. This way, businesses can make informed decisions, adapting to and even predicting customer needs.
Some Real-Life Applications:
The Healthcare Sector: Visualizing patient data to track the spread of diseases and the effectiveness of treatments.
Finance and Banking: Analyzing trends in stock prices, market dynamics, and customer demographics to make informed decisions.
Environmental Studies: Mapping climate change data to understand the impact of human activities on global temperatures.
Mastering the Art of Data Visualization
Data visualization is not just about making pretty graphs but about instilling meaning into numbers. It's a craft that combines creativity with analytics. As you delve into this field, remember that the best visualizations are those that communicate the right message, to the right people, at the right time.
In our journey to comprehend the vast oceans of data, effective visualization is our most trusted compass and map. It's not just about reaching the destination of Insight but about enjoying the voyage of discovery along the way.
Up Next: Stay tuned for our next issue, where we'll explore the art of the pie chart visualization techniques and tools that can elevate your storytelling to the next level.
